5 ways in which an online publication can give you insight for the offline version
Although the reading experience of the online version of the brochure is different from the offline version, it does not necessarily mean that the insights of the online version say nothing about the offline version. The content is the same in both versions. So the attention readers give to certain content items or categories can tell something about how readers read a publication. An added advantage is that data from the online version is collected much faster (and cheaper) than with customer panels. In addition, the data from the online version maps real behavior, which is completely different from the opinions of a panel.
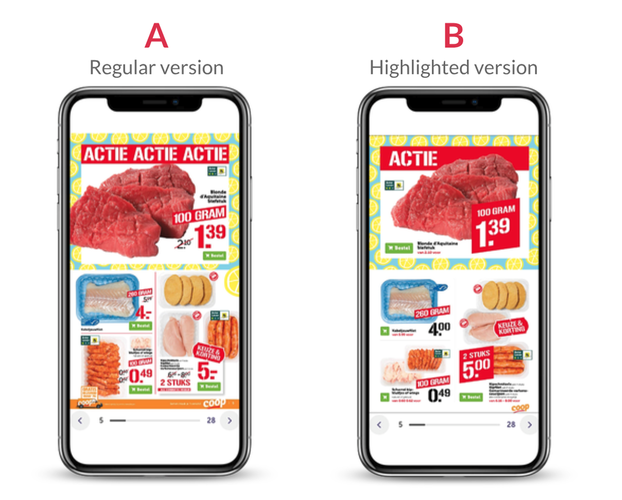
A/B testing

The online flyer can be manipulated in several ways. Creating an A and B version of the online flyer need not be very intensive. But showing different versions to different readers can yield results in how much attention different elements of the leaflet attract. This allows you to decide which elements do well or not so well in the online flyer.
Price communication


One of the elements you can manipulate is the color of the prices. If you change 1 or 2 items with a different color and compare it to the normal version, it becomes clear how much difference a color change can make. For example, color change makes people more likely to click on something and they give the item more attention.
Products per page


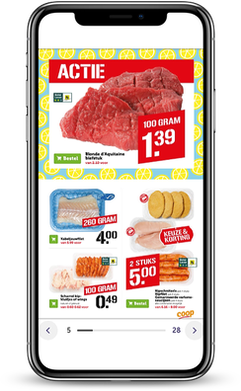
Another element of the flyer that can be measured with data from the online flyer is the amount of products per page. The amount of space is a precious element of the flyer, so you could find out how many items (in a specific category) are ideal for your readers. Manipulating the number of products per page in an A/B test shows how much interest readers have on that page. Multiple tests can help determine the ideal product per page ratio in certain categories.
Grid layout
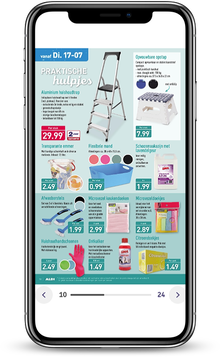
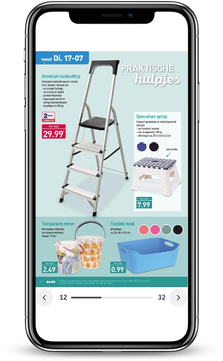
Choosing a grid for the flyer is a study in itself. Remember to test different grids in the online version, this way you can quickly gain insight into reader behavior. Route the same amount of products in a more (or less) structured grid to see if people behave differently. And, of course, measure whether these changes are significant or not. The final result of the measurements will reveal which grid works best for your leaflet.
Interest offer
Choosing your hero offers comes with a lot of internal collaboration. But shoppers give clear signals about whether they are interested in a hero offer in an online flyer. If you track when specific offers perform best, you'll get a lot of information about when people do or don't choose a particular item as a hero. Don't just let internal factors play a role, but factor customer behavior into this decision-making process.


